The geotechnical profile of St. Louis shifts dramatically from the riverfront to the western suburbs. Near the Mississippi, alluvial deposits create thick, compressible clay layers, while neighborhoods like Dogtown and Clifton Heights sit on weathered residuum over karst limestone. This contrast demands precise plasticity data. A clay with a liquid limit of 65 in the floodplain may behave very differently than a lean clay with a liquid limit of 32 on a bluffs site. Our ISO 17025-accredited lab runs grain size analysis alongside Atterberg limits to classify these soils correctly. Without this, a footing designed for one St. Louis neighborhood could be critically undersized in another, especially where loess-derived silts dominate the near-surface geology.
A five-point plasticity index difference can shift a St. Louis soil classification from CL to CH, completely altering the required bearing capacity verification under IBC Chapter 18.
Process and scope
Local ground factors
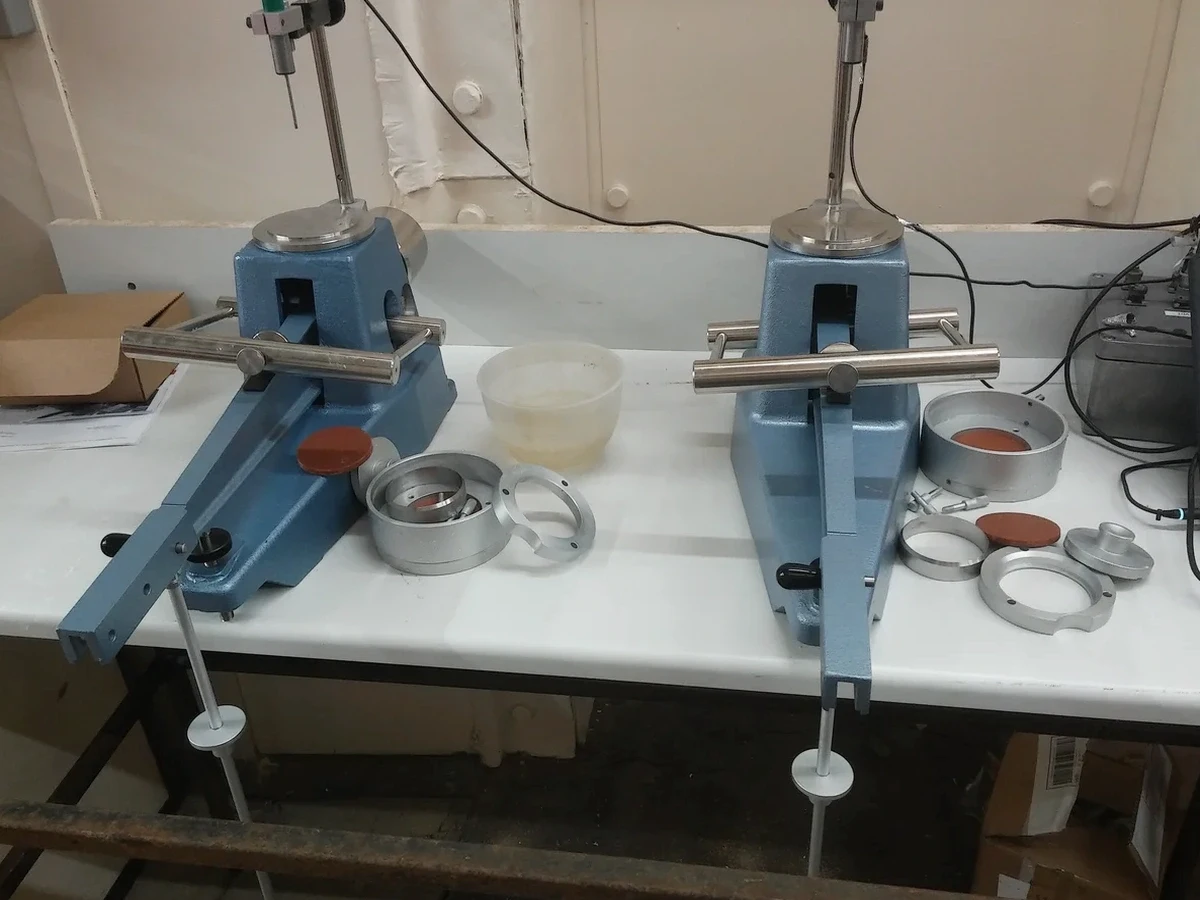
A brass Casagrande cup, precisely machined to a 50-gram weight and a 10 mm drop height, is the tool we use daily in our St. Louis lab. When a soil sample from the I-64 corridor comes in with a natural moisture content near its liquid limit, the risk of bearing capacity failure under seismic load becomes a real concern. St. Louis sits in Seismic Design Category D due to the New Madrid Seismic Zone. High-plasticity clays (CH) are particularly susceptible to cyclic softening. Skipping the Atterberg limits means missing the critical index that flags a soil as moderately or highly plastic. That oversight can lead to selecting a shallow foundation system where deep piles were actually required, especially in the low-lying areas of the River Des Peres basin where groundwater is shallow and clay sensitivity is high.
Reference standards
ASTM D4318, ASTM D2487, AASHTO T 89, AASHTO T 90, ASCE 7-22
Associated technical services
Complete Soil Classification Package
We combine Atterberg limits with hydrometer and sieve analysis to produce full USCS classifications with group symbols and names, prepared under ASTM D2487.
Correlation & Reporting
We provide the liquidity index, activity ratio, and correlations to undrained shear strength for quick assessments of preconsolidation stress in St. Louis basin clays.
Site-Specific Material Verification
Routine testing of fill and borrow materials to confirm they meet Missouri DOT plasticity specifications prior to structural backfill placement.
Typical parameters
Questions and answers
What is the standard turnaround time for Atterberg limits testing in St. Louis?
Standard reporting is two to three business days from sample receipt. We can accommodate same-day results for urgent foundation inspections when samples arrive before 10:00 a.m., provided the material quantity allows immediate multi-point liquid limit preparation.
How much does Atterberg limits testing cost?
For St. Louis projects, a single-point liquid limit with plastic limit typically runs between US$60 and US$110, depending on whether the sample requires washing or extended preparation due to high organic content.
Do you need to test the soil at its natural moisture content first?
We always record the field moisture condition upon sample intake. If the natural water content is close to the estimated liquid limit, we flag the soil as potentially sensitive and recommend running the liquidity index calculation alongside the standard Atterberg limits.
Can you test samples of the local loess or very silty material?
Yes, the Peoria Loess common across St. Louis tests well under ASTM D4318. The silt fraction often means a low plasticity index, so we run the fall cone method as a supplementary check when the Casagrande cup results fall below a plastic limit of 18.